
Metal casting is the invisible backbone of modern manufacturing. From the crankshafts in trucks to turbine blades, almost every industry depends on cast metal components. Yet, casting defects remain a persistent and costly challenge. Small imperfections introduced during pouring or solidification can jeopardize product integrity, trigger scrap losses, and erode profitability.
Understanding Casting Defects
Casting defects are unintended irregularities that compromise dimensional accuracy, surface finish, or mechanical properties. They may appear as surface blemishes, internal voids, or compositional anomalies. These flaws can result from errors in design, melting, pouring, mold preparation, or cooling.
Table 1. Common Categories of Casting Defects
| Category | Typical Defects | Visual Indicators | Major Causes |
| Dimensional | Mismatch, distortion | Misaligned parting line | Core shift, poor alignment |
| Surface | Blister, burn-on, scab | Rough, irregular surfaces | High temperature, poor coating |
| Internal | Porosity, shrinkage cavity | Hidden voids detected by X-ray | Gas entrapment, solidification shrinkage |
| Inclusions | Slag, oxide, dross | Dark spots, low strength | Inadequate skimming, turbulence |
| Metallurgical | Hot tear, segregation | Cracks after cooling | Improper alloy control, uneven cooling |
Each defect type demands a targeted prevention strategy—rooted in a deep understanding of fluid dynamics, thermodynamics, and materials science.
Sources of Defects in Metal Casting
Defects often originate from a combination of mechanical, thermal, and human factors. Below are the five most common origins and their mechanisms:
Melt Quality Issues
Poor-quality molten metal can introduce gas porosity and inclusions. Excessive hydrogen in aluminum or oxygen in steel creates trapped bubbles. Improper slag removal and inadequate fluxing further degrade melt cleanliness.
Molding and Core Errors
Defective molds—caused by poor sand quality, incorrect binder ratio, or damaged patterns—result in dimensional inaccuracies or surface scabs. Uneven ramming pressure can also distort cavity geometry.
Pouring Conditions
If metal is poured too slowly, cold shuts or misruns occur. If too fast, turbulence causes oxide films or slag entrapment. Pouring temperature and ladle tilt angle must be carefully optimized.
Solidification and Cooling
Uneven cooling leads to internal stresses, shrinkage cavities, or hot tears. Thermal gradients must be controlled through risers, chills, and directional solidification principles.
Design Deficiencies
Improper gating and riser design—often overlooked—can create turbulence, air aspiration, or incomplete feeding. Advanced simulation tools are now essential to predict these flow and thermal behaviors.
Melt Preparation and Quality Control
High-quality castings start with high-quality melts. Controlling the chemistry and cleanliness of the molten metal is the first line of defense against many defects.
Alloy Control
Maintaining alloy composition within specification ensures predictable mechanical performance. Even slight variations in carbon or silicon levels can change the microstructure and solidification behavior.
Degassing and Filtration
For aluminum and magnesium alloys, rotary degassing with inert gas (argon or nitrogen) removes hydrogen. Ceramic foam filters trap nonmetallic inclusions before metal enters the mold.
Figure 1. Schematic of Degassing and Filtration System
[Furnace] → [Ladle] → [Rotary Degasser] → [Ceramic Filter] → [Mold]
Slag and Dross Management
Regular skimming prevents reintroduction of oxides. Fluxes form protective layers that minimize oxidation and improve wetting between metal and mold surfaces.
Temperature Monitoring
Thermocouples and immersion pyrometers ensure accurate pouring temperature. Overheating leads to erosion of refractories; underheating risks incomplete filling.
Mold and Core Preparation
The mold is the silent partner in defect prevention. Its composition, permeability, and strength directly determine surface quality and dimensional fidelity.
Sand Quality
For sand molds, the grain size distribution affects permeability and collapsibility. A well-graded sand allows gases to escape without compromising strength.
Binder Ratio and Curing
Too much binder causes gas evolution and blowholes; too little results in weak molds that erode easily. Modern foundries use automated sand mixers and spectroscopic sensors to control binder dosage.
Core Design and Venting
Cores must include adequate vents to allow gases to escape. Improper venting causes internal gas defects, especially in complex cavities.
Coating and Refractory Layers
Coatings form a barrier between metal and sand, improving surface finish. They must be evenly applied and fully dried; moisture is a prime source of steam explosions and blows.
Gating and Riser Design
Perhaps the most decisive factor in preventing casting defects lies in the design of the gating and feeding system. The goal is laminar metal flow and effective compensation for shrinkage.
Gating System Principles
A gating system consists of the pouring basin, sprue, runner, and gates. Its design should minimize turbulence and air aspiration.
Figure 2. Typical Gating System Layout
[Pouring Basin]
↓
[Sprue]
↓
[Runner] → [Ingate] → [Cavity]
Key parameters include:
- Sprue height and taper to prevent aspiration
- Runner-to-gate ratio to maintain uniform flow
- Fillet radii to smooth directional changes
Riser and Feeding Design
Risers supply molten metal to compensate for solidification shrinkage. The modulus method and software-based simulation ensure riser solidifies last.
Table 2. Riser Design Rules of Thumb
| Alloy Type | Shrinkage % | Typical Riser Volume Ratio | Feeding Aid |
| Gray Iron | 1 | 1.0–1.2 × casting volume | None |
| Steel | 2–3 | 2.5–3.0 × casting volume | Exothermic sleeve |
| Aluminum | 3–6 | 3.0–4.0 × casting volume | Insulating sleeve |
| Bronze | 3–5 | 2.5–3.5 × casting volume | Hot-top riser |
Directional solidification should progress from thin to thick sections, avoiding isolated hot spots.
Pouring Process Optimization
Pouring Temperature and Speed
Temperature controls fluidity; speed controls turbulence. Aluminum typically pours at 680–720 °C, gray iron around 1380–1450 °C. Automated pouring machines now maintain temperature within ±5 °C and rate within ±3%.
Ladle Design and Tilt
Bottom-pour ladles reduce turbulence and oxidation. A smooth, controlled tilt minimizes vortex formation.
Environmental Control
Humidity and dust can cause mold moisture pickup or inclusion contamination. Enclosed pouring stations with laminar air curtains mitigate these risks.
Operator Training
Even with automation, human oversight matters. Pouring should be continuous and uninterrupted. Skilled operators recognize subtle color or viscosity changes that sensors may miss.
Solidification and Cooling Control
Directional Solidification
Controlled cooling ensures feeding of shrinkage cavities. Chills (metal inserts) accelerate cooling in thick sections, while insulating sleeves slow cooling in thin ones.
Figure 3. Controlled Solidification Principle
[Chill] → Rapid cooling → Early solid zone
[Riser] → Slow cooling → Liquid until last
Shrinkage Prevention
Feed paths must remain open until solidification completes. Premature freezing at gates isolates liquid metal and traps voids.
Stress and Hot Tear Reduction
Uniform cooling reduces residual stresses. Mold coatings, flexible cores, and proper parting line placement minimize restraint.
Mold Shakeout Timing
Premature shakeout can warp hot castings; delayed shakeout may cause oxidation. Ideal shakeout occurs when the metal reaches 400–600 °C depending on alloy type.
Gas Defects and Their Control
Gas defects—blowholes, pinholes, and porosity—are among the most common casting problems.
Sources of Gas
- Dissolved gases: Hydrogen in aluminum, nitrogen in steel.
- Mold gases: From binders, oils, or moisture.
- Entrapped air: From turbulence or improper gating.
Preventive Actions
- Use preheated charge materials.
- Employ degassing tablets or rotary degassing.
- Bake molds and cores to remove moisture.
- Maintain laminar flow in gating design.
Table 3. Gas Defect Symptoms and Remedies
| Symptom | Likely Cause | Preventive Action |
| Round surface pits | Hydrogen gas | Improve degassing |
| Irregular cavities | Binder gas | Bake cores longer |
| Clustered pinholes | Air aspiration | Redesign gating system |
| Blowholes near riser | Late gas release | Increase venting, reduce pouring rate |
Inclusion and Dross Defects
Inclusions act as crack initiators and reduce fatigue life. Preventing them requires a combination of process cleanliness and flow control.
Inclusions in Ferrous Alloys
Oxides and slag result from high oxygen levels or turbulence. Deoxidizers such as aluminum or silicon form stable compounds that float out.
Dross in Non-Ferrous Alloys
Dross forms when metal reacts with air during holding. Fluxes reduce oxidation and help coalesce metal droplets trapped in the dross.
Filtration and Flow Control
Ceramic foam filters (10–30 ppi) are effective in trapping inclusions. Flow simulation ensures placement minimizes head loss.
Shrinkage and Porosity Prevention
Understanding Shrinkage Mechanisms
As molten metal solidifies, its density increases, leaving voids if not fed properly. Two types exist:
- Micro-shrinkage: Dispersed, microscopic cavities.
- Macro-shrinkage: Large cavities visible in radiographs.
Feeding Aids
- Exothermic risers maintain feeding temperature.
- Insulating sleeves delay heat loss.
- Chills promote directional solidification.
Process Simulation
Modern casting simulation software predicts shrinkage and porosity before production. Adjusting riser size, gate location, and cooling rates reduces defect probability by up to 90%.
Hot Tears and Cracks
Thermal stress defects such as hot tears occur when metal contracts but is restrained by the mold or adjacent solidified regions.
Causes
- Uneven cooling rates.
- Sharp corners or thin-to-thick transitions.
- Inadequate alloy ductility during solidification.
Design Solutions
- Use generous fillets at junctions.
- Apply chills to balance cooling.
- Use flexible cores or collapsible sand.
Alloy Modification
Adding grain refiners like titanium-boron (in aluminum) or inoculants (in cast iron) refines structure and improves ductility during solidification.
Surface Defects and Finishing
Burn-On and Scabbing
These defects arise from metal penetration into sand. Remedies include refractory coatings, harder mold surfaces, and lower pouring temperatures.
Erosion and Wash Defects
Turbulent flow or poor gating can erode mold walls. Smoother runners and ceramic filters reduce impact velocity.
Cold Shuts and Misruns
Caused by insufficient temperature or slow pouring. Increasing superheat and improving gating balance ensures complete filling.
Cleaning and Finishing
Shot blasting, grinding, and pickling remove residual sand and oxides. Automated blast systems provide consistent surface texture.
Advanced Monitoring and Process Control
Digitalization and Industry 4.0 technologies are revolutionizing defect prevention.
Sensor Integration
Thermocouples, vibration sensors, and optical pyrometers feed real-time data into control systems. Abnormal temperature gradients trigger alarms before defects form.
Data Analytics
Machine-learning algorithms detect subtle correlations between process variables and defect occurrence, allowing predictive interventions.
Figure 4. Closed-Loop Defect Prevention System
Sensors → Data Logger → AI Model → Control Feedback → Process Adjustment
X-Ray and Ultrasonic Inspection
Non-destructive evaluation (NDE) identifies hidden voids or inclusions. AI-based image recognition now accelerates defect classification.
Digital Twins
A digital twin mirrors the physical casting line, simulating real-time behavior under varying conditions. It enables virtual experiments to prevent costly defects.
Process Optimization and Continuous ImprovementStatistical Process Control (SPC)
Control charts for temperature, composition, and sand compactability detect trends before they produce defects. Standard deviation limits maintain consistency.
Root Cause Analysis
When defects occur, structured methods like the “5 Whys” or fishbone diagrams identify underlying causes, not just symptoms.
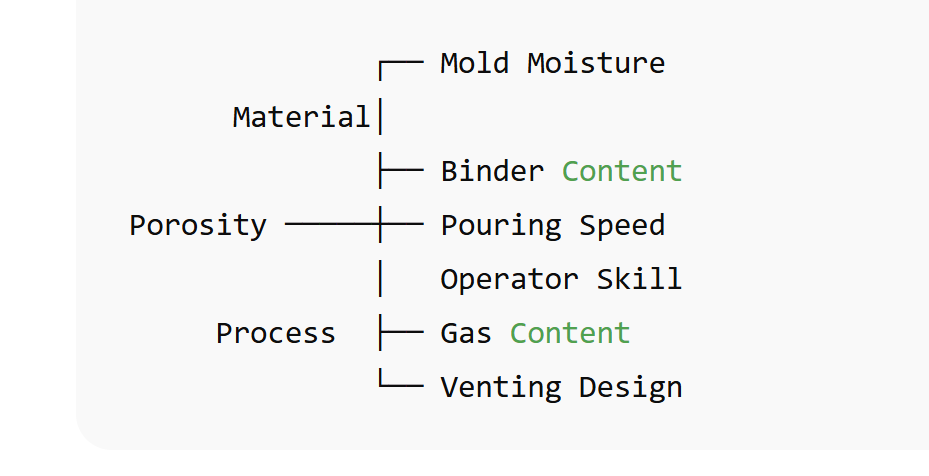
Figure 5. Example of Fishbone Diagram for Porosity
Kaizen and Lean Approaches
Regular process audits and small incremental changes sustain defect reduction. Cross-functional teams share insights between melting, molding, and finishing departments.
Human Factors and Training
No technology can substitute for a skilled workforce. Many casting defects trace back to lapses in training or communication.
Standard Operating Procedures
Written instructions must specify precise values—temperatures, times, pressures—avoiding ambiguous language like “moderate” or “sufficient.”
Visual Aids
Posters, videos, and color-coded flow diagrams help workers recognize correct and incorrect mold conditions.
Skill Development
Certification programs in foundry technology strengthen understanding of fluid flow, metallurgy, and safety—directly lowering defect rates.
Culture of Quality
Rewarding teams for zero-defect batches fosters ownership. Regular quality meetings ensure alignment between engineering and production.
Case Study: Automotive Aluminum Casting
An automotive foundry producing cylinder heads faced 8% rejection due to porosity. After implementing an integrated prevention program:
- Installed rotary degassing with nitrogen.
- Redesigned riser with exothermic sleeve.
- Introduced ceramic filters in gating.
- Added real-time thermal sensors.
Results:
- Porosity reduced from 8% to 0.8%.
- Yield improved by 12%.
- Machining scrap costs decreased by 30%.
This illustrates how systematic defect prevention transforms both quality and profitability.
Environmental and Sustainability Benefits
Defect prevention is not only about quality—it’s also about sustainability. Each rejected casting represents wasted metal, sand, and energy.
Energy Savings
Reducing scrap by 5% can lower furnace energy consumption by up to 15%, since fewer remelts are required.
Waste Reduction
Reclaiming sand and minimizing slag disposal contribute to circular economy goals.
Emission Control
Cleaner melting practices and reduced rework cut CO₂ emissions and improve worker health.
Summary of Preventive Measures
Table 4. Comprehensive Defect Prevention Checklist
| Process Stage | Key Preventive Actions |
| Melting | Control alloy chemistry, degas, filter, deslag |
| Molding | Use high-quality sand, correct binder ratio, ensure venting |
| Pouring | Maintain temperature and speed, minimize turbulence |
| Solidification | Design for directional cooling, use chills and risers |
| Finishing | Inspect visually and with NDE, perform consistent cleaning |
| Quality Control | Apply SPC, AI analytics, and feedback loops |
Defect prevention is achieved not through isolated fixes but through integrated control across the entire value chain.
Future Trends in Defect Prevention
Additive-Assisted Molding
3D-printed sand molds allow precise gating geometries that minimize turbulence and reduce core seams.
Real-Time Predictive Analytics
AI models trained on thousands of production runs predict defect probabilities before casting begins.
Smart Materials
Self-healing refractories and advanced coatings resist erosion and thermal shock, extending mold life.
Sustainability-Driven Design
Lightweight alloys and optimized riser geometry cut material use while maintaining strength.
Economic Impact
The financial advantage of defect prevention is enormous. For a medium-sized foundry producing 10,000 tons annually:
- Each 1% reduction in scrap saves roughly $250,000 per year.
- Fewer defects reduce rework labor and inspection costs.
- Improved reliability strengthens supplier reputation and customer trust.
Table 5. Cost Distribution Before and After Defect Prevention
| Cost Category | Before Defect Prevention (%) | After Defect Prevention (%) | Change Trend |
| Raw Material | 60 % | 60 % | — (unchanged) |
| Energy | 15 % | 12 % | ↓ Reduced energy use via fewer remelts |
| Scrap / Rework | 15 % | 5 % | ↓ Significant improvement from process control |
| Labor | 10 % | 8 % | ↓ Improved efficiency and less rework |
| Total | 100 % | 100 % | — |